Trail Difficulty Metrics: What the Numbers Leave Out
Why quantitative rating systems miss the ground-level intelligence that daily riders depend on
Explore why trail difficulty metrics, while useful, fail to capture the sensory and technical realities riders face on the ground. Learn what loose shale, shifting conditions, and rider experience reveal that no rating formula can.
TL;DR
Trail difficulty metrics are a starting point, not the full picture - Systems like IMBA rate technical features at a point in time but can't account for how weather, erosion, and daily conditions change what you'll actually ride.
The gap between "rated" and "real" is a safety issue - Loose surfaces, blind exits, and shifting terrain don't show up in elevation profiles or distance calculations. Real-time, local knowledge fills this gap.
Treat ratings like an old weather forecast - Useful context, not operational truth. Pair metrics with fresh intelligence from guides, recent riders, or local experts before committing to unfamiliar terrain.
The best user experience on trails comes from human networks, not just data - Trails that feel great to ride are the ones backed by people who know the dirt today, not just the numbers from last season.
The Number Said Moderate. The Mountain Disagreed.
You've studied the trail profile. You've checked the elevation gain, the distance, the rating. Everything says "moderate." Then you drop in, and the first switchback is a chute of loose shale that moves under your tires like a living thing. Your bars shimmy. Your back wheel hunts for grip. Nothing about this feels moderate. Trail difficulty metrics gave you the data. They just forgot to mention the part that actually matters.
The Comfort of a Clean Number
Rating systems exist for good reason. The IMBA Trail Difficulty Rating System evaluates tread width, surface type, grade, and natural obstacles. It gives trail managers a shared vocabulary and gives riders a starting point. Other frameworks, like the one Shenandoah National Park uses , distill difficulty into a formula: the square root of elevation gain times two times distance. Elegant. Portable. Easy to print on a trailhead sign.
These systems became popular because they solve a real problem: how do you communicate trail conditions to strangers who've never set foot on the dirt? A single label or number travels well. It fits in an app. It gives you confidence before you've earned it.
But here's where confidence becomes a liability. The label collapses everything into one dimension. And trails don't live in one dimension.
What the Rating Can't Encode
Here's what we actually believe: trail difficulty metrics are a skeleton, not a body. They tell you the shape. They can't tell you how it moves.
A rating system can note that tread surface ranges from "hardened" to "loose and unpredictable." It cannot tell you that the loose section sits on a north-facing slope that stays damp until noon, or that afternoon wind deposits a fresh layer of gravel across a rock slab that was clean yesterday. That intelligence doesn't live in a database. It lives in the legs and eyes of someone who rode it this morning.
The Gap Between the Map and the Ground
Consider how trail ratings actually get built. The IMBA framework explicitly states that there is no prescribed method for tallying a final score. Judgment is required. That means a trail's rating reflects one person's assessment, often made on a single day, in specific conditions. It captures a snapshot, not a season.
Now think about what changes between that snapshot and your ride. Rain reshapes drainage patterns. Goats loosen a rock garden. A section that was hardpack in spring becomes sand in August. A 2023 study in the European Journal of Geography tried to define trail difficulty by measuring inclination across 100-meter and 5-meter sections, noting that steep short sections signal required technical skills while exposed sections signal risk. Useful distinctions. But even this granular approach can't tell you that the 5-meter section with 45-degree pitch also has a blind drop on the exit that you won't see until your front wheel is over it.
This is the fundamental mismatch. Technical difficulty trails demand real-time awareness, not retrospective measurement. The metrics describe the trail as an object. Riding demands you understand it as an event, something unfolding under your wheels right now, shaped by weather, season, time of day, and the fifty riders who came through before you.
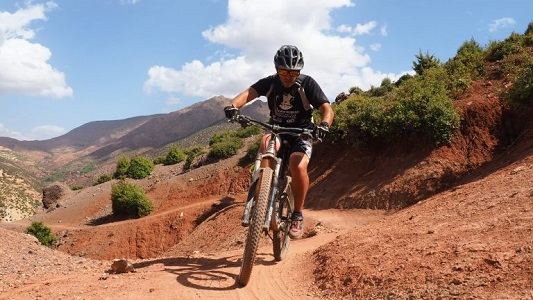
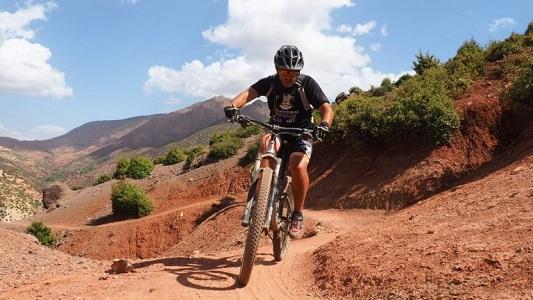
We've seen this pattern repeatedly in the Atlas Mountains. A trail that descends through a valley might cross three distinct soil types in two kilometers: packed red clay, fractured limestone, then sandy wash. The elevation profile looks uniform. The ride is anything but. A local guide who's ridden that descent hundreds of times knows that the clay gets slick after morning fog, that the limestone section has one boulder that migrated left since last month, and that the sandy wash is firmer on the right edge near the scrub. No rating system captures this. No app updates that fast.
This is exactly why companies like Atlas Mountain Bike build their trips around local guides who ride the same trails daily. When you're navigating Moroccan terrain , the difference between a good day and a bad one often comes down to whether someone told you to shift your weight back before that third switchback, or to take the left line through the rock garden because the right one washed out last week. That's not information you'll find in a trail profile.
A 2024 study on digitally derived terrain metrics points to growing use of digital analysis to quantify conditions beyond simple distance-and-elevation labels. This is progress. But even the most sophisticated digital model is measuring the trail as it was, not as it is. The gap between "was" and "is" can be the gap between a clean line and a collarbone.
What Changes If the Rating Is Just the Beginning
If this is right, it reshapes how you plan every ride in unfamiliar terrain. It means the pre-trip research phase isn't done when you've checked the numbers. It's barely started. You need to ask: who rode this recently? What changed? What does the rating not account for?
It also means that user experience trails, the ones that actually feel good to ride, aren't necessarily the ones with the best ratings infrastructure. They're the ones with the best local knowledge networks. The trails where someone can tell you, "Not today, take the south route instead" and save you from a miserable slog through post-rain mud.
For riders planning mountain biking adventures in Morocco or anywhere with variable, mountainous terrain, this has real stakes. The cost of ignoring ground-level intelligence isn't just a less fun ride. It's a safety question.
Read the Trail, Not Just the Rating
Here's a better mental model: treat trail ratings the way you'd treat a weather forecast from three days ago. Useful context. Not operational truth. The forecast tells you the general pattern. The sky above your head tells you whether to bring the rain shell.
The rating is the forecast. The guide, the local rider, the trip report from yesterday: that's the sky. Build your decisions from both, but when they conflict, trust the one with fresher data. The best riders we know don't ignore metrics. They just never mistake them for the whole story.
The Trail Knows More Than the Sign
Difficulty isn't a number. It's a negotiation between you, the terrain, and the conditions on the day you show up. The riders who understand this don't ride harder. They ride smarter. They ask better questions. They listen to the people who know the dirt under their wheels, not just the data about it.
The sign at the trailhead will still say "moderate." The mountain will still have its own opinion. The question is whose briefing you trust before you drop in.
Frequently Asked Questions
What is the IMBA Trail Difficulty Rating System and what does it actually measure?
The IMBA system evaluates technical challenge based on tread width, surface type, grade, and natural obstacles. It does not measure overall physical effort, and it explicitly notes that no prescribed scoring method exists, so judgment is always part of the final rating.
Why do trail difficulty metrics sometimes feel inaccurate on the ground?
Ratings capture a snapshot of trail conditions at a single point in time. Weather, erosion, traffic, and seasonal changes constantly alter the actual riding surface, which means the conditions you encounter may differ significantly from what was measured.
How can local trail knowledge improve safety on technical difficulty trails?
Guides and local riders who ride trails daily carry real-time intelligence about surface changes, hazards, and line choices that no rating system updates fast enough to reflect. This ground-level awareness helps riders make better decisions and avoid conditions that metrics alone would miss.